Now we offer our customers access to a web-based tool for visualizing basic statistical operations carried out on metabolomic data.
Features
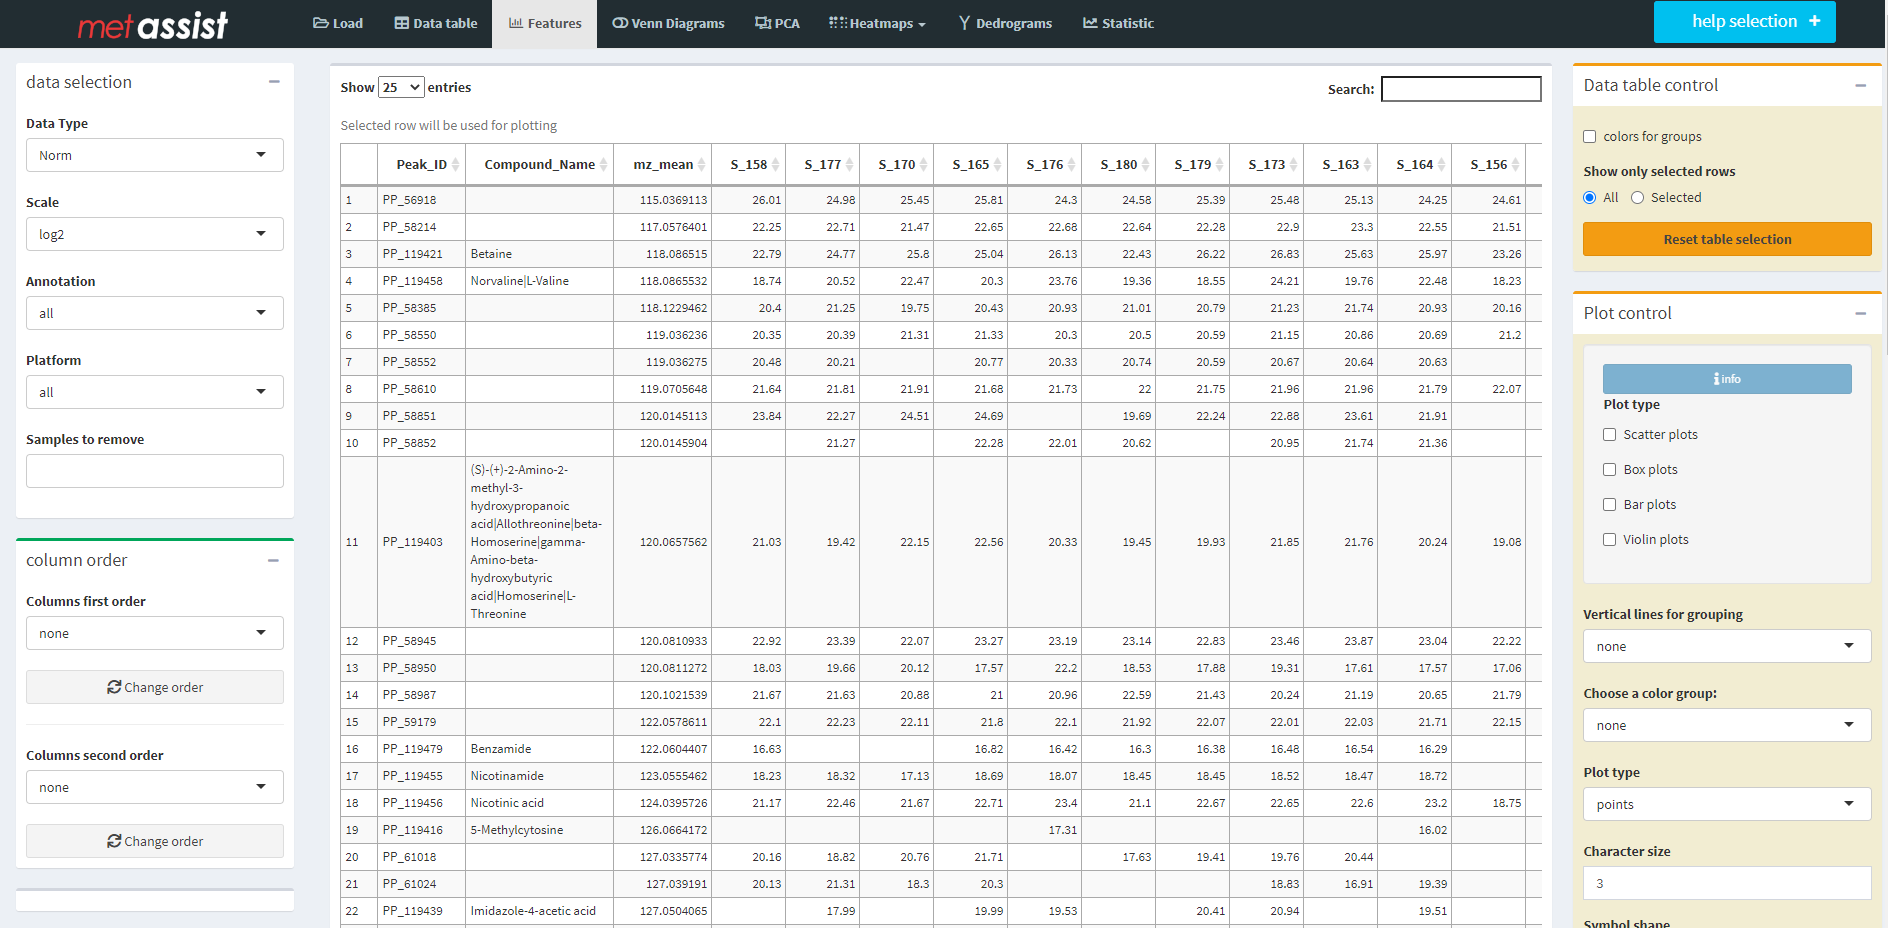
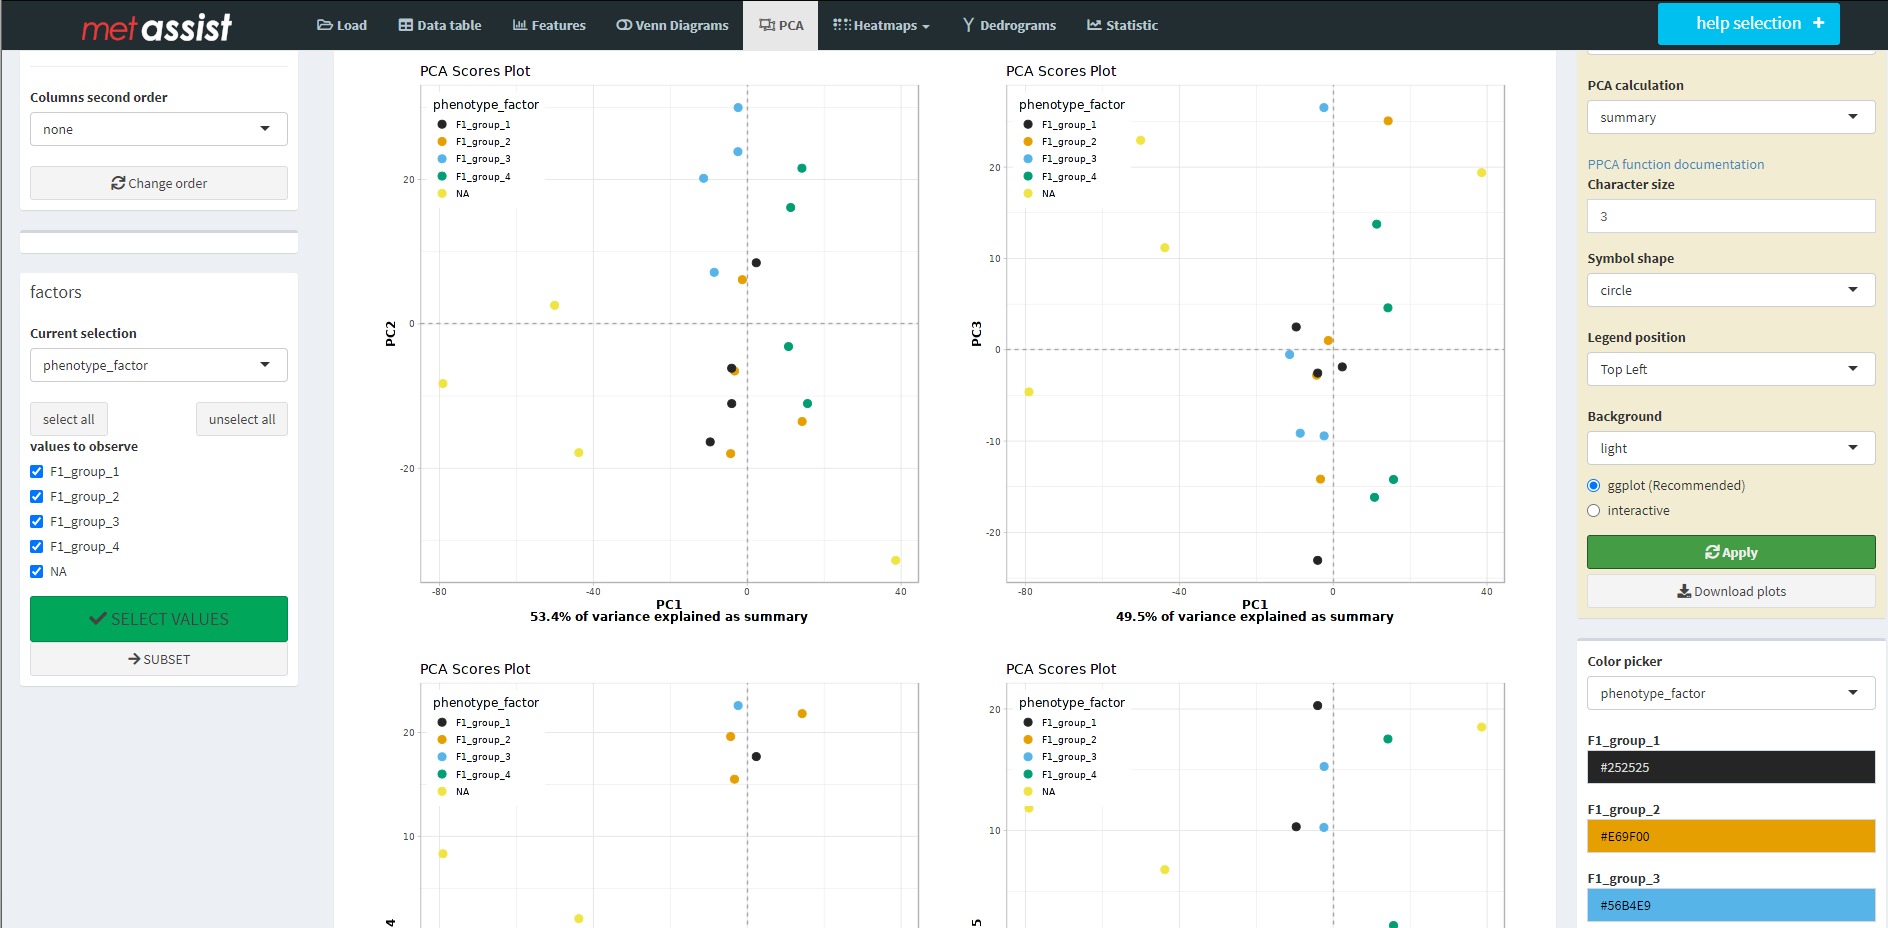
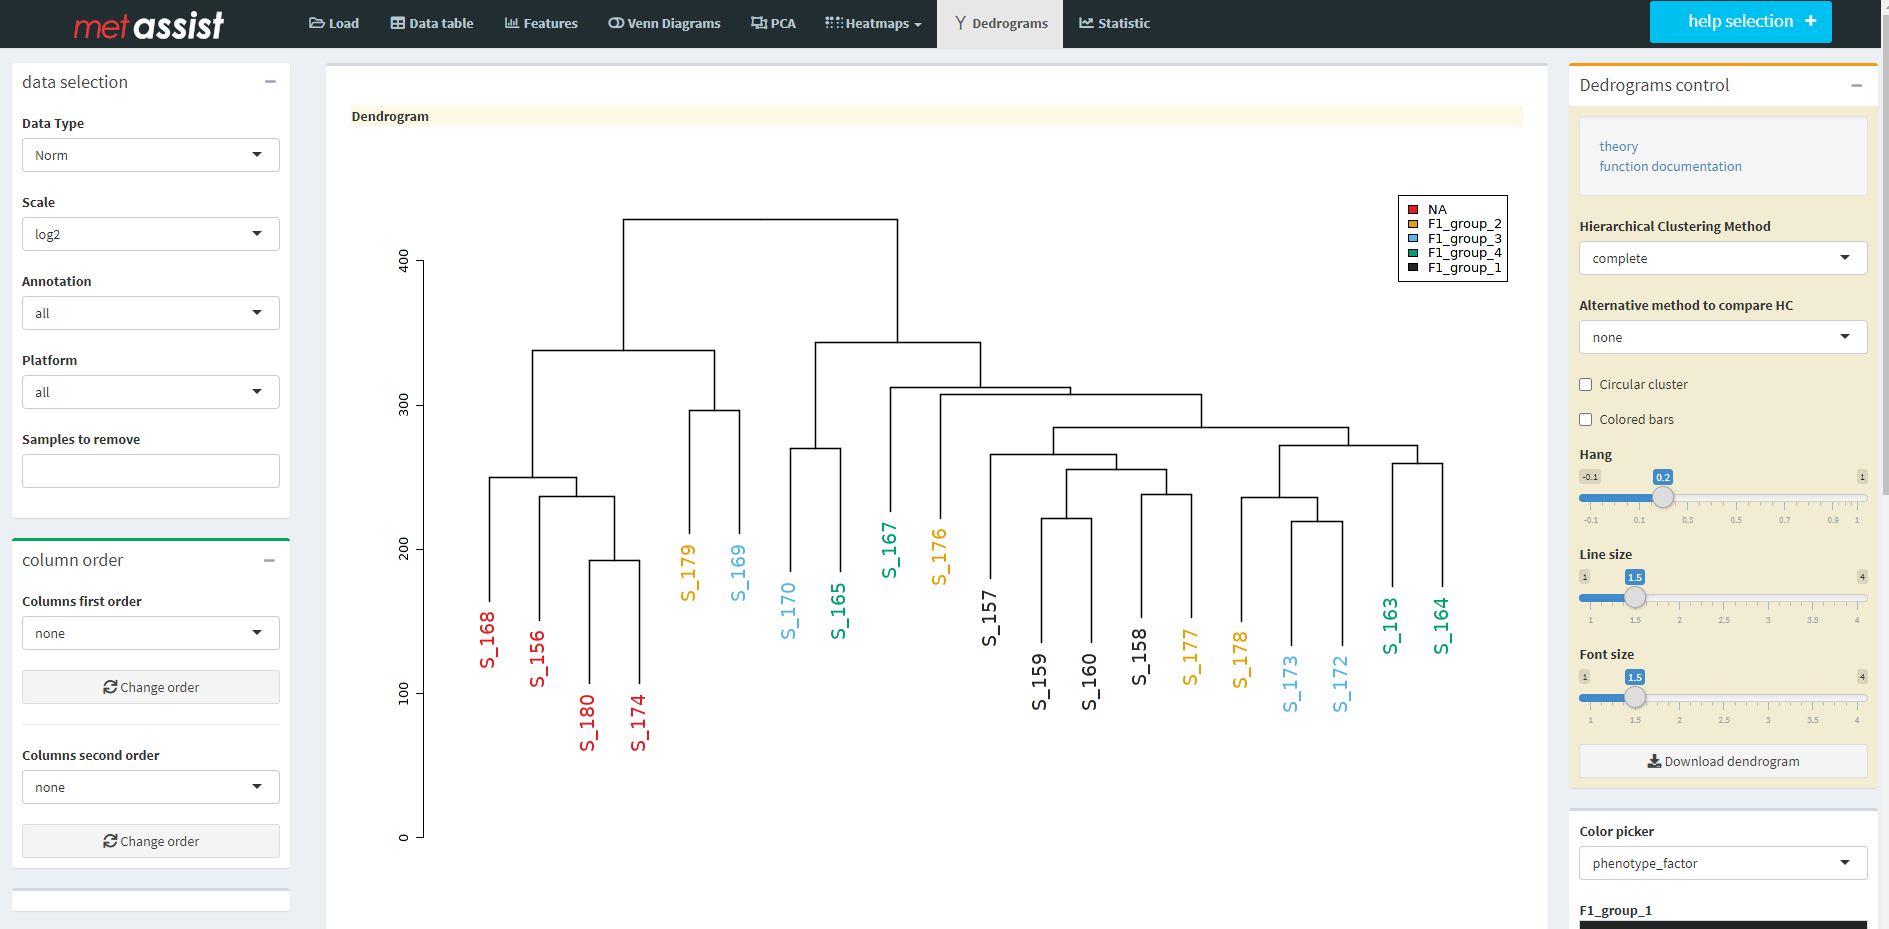
- The platform gives you the ability to perform visualizations in the browser. For many chart types, we have both static and interactive versions available.
- You can also conveniently download pdf charts for use in a later presentation or report.
- The tool is available for each set of metabolomic data analyzed by metasysx. We provide our customers with a table of standardized and raw data of the material analyzed by us. Now thanks to our online platform - this data we can easily visualize and carry out a simple operation on them like grouping or subsetting.
- The metassist tool is still under construction and testing. That's why we encourage our customers to share their opinion about possible amenities or useful additional features.
Technology
- The tool is built in R languge , using R Shiny and Tidyverse libraries.
- We also use ShinyProxy platform so we are able to offer very convenient cloud solutions for our customers.